Market Summary
-
BTC is down
70%
from all-time highs.
-
Bitcoin has experienced significant downside volatility over the past fortnight, falling from
$31,000
to lows of
$17,750
.
- Significant price levels:
-
Supports:
$20,000
,
$17,600
and
$15,000.
-
Resistances:
$21,400
and
$23,000.
-
Combining technical levels with our option flow model, we are expecting Bitcoin’s price to range between
$17,600
and
$23,000
over the next week.
Technical Levels

The current drawdown has lasted 225 trading days compared to an average of 386 trading days from the last two bear markets. The last two bear markets took 406 and 366 trading days to reach their low. Bitcoin has dropped approximately 70% since all-time highs to the current price level of $20,000. The average percentage of the drawdowns has been 85.65%. Based on historical data, Bitcoin may still have 50.50% to extend further from its current price.
However, compared to previous market cycles, the cryptocurrency industry has developed greater maturity and has attracted additional institutional investment. This fact could potentially lead to the drawdown in Bitcoin not being as severe as in previous bear markets.
Over the last fortnight, Bitcoin dropped 32% and closed at $20,574, with its current local low at $17,622. Binance’s trading volume during last week’s selloff was almost triple the magnitude compared to its moving average of 419,650. Selloffs with high volume tend to indicate forced selling and liquidations. This was evident with news that several large entities are facing liquidity issues.
Bitcoin dropped below its previous neutral zone 3 days after the publication of our last fortnightly newsletter on 8th June 2022. It then ranged between $28,700 and $32,300 for 32 trading days. After this zone broke down, its price continued to drop by 38%. Bitcoin may find temporary support at $20,000, as mentioned in the last fortnight’s newsletter, with a resistance level of around $23,000 since the rebound failed to break through this level.
To conclude, we forecast Bitcoin to range between $17,600 and $23,000 over the following week.
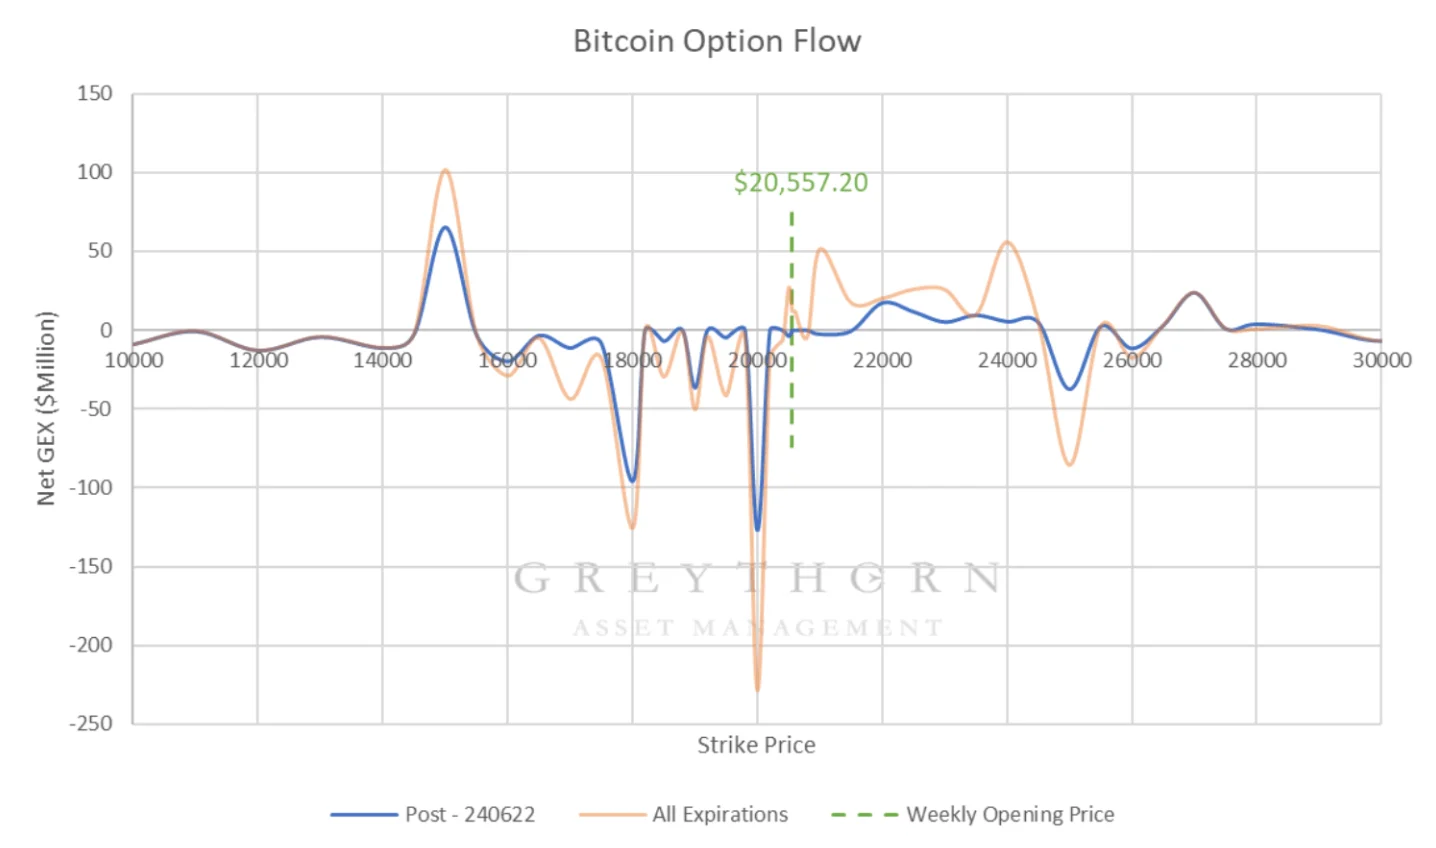
- The first support level is at around $20,000, followed by the second support level, which was a recent low, at approximately $17,600. Combining with Greythorn’s option flow model, the next strong support level is around $15,000, should Bitcoin decrease below $17,600.
- The first resistance level is at around $21,400, as displayed by Greythorn’s option flow model, followed by a secondary resistance level at about $23,000.
For more information regarding support and resistance levels, please refer to Support (Support Levels): https://www.investopedia.com/terms/s/support.asp
and Resistance (Resistance Levels): https://www.investopedia.com/terms/r/resistance.asp .
Greythorn Option Flow Model
Greythorn’s view of markets is significantly dependent on supply & demand mechanics. As crypto markets mature & attract large flows of capital, their derivatives markets also grow. Derivatives markets tend to have a large influence on their underlying assets as market participants tend to hedge their exposure through spot & futures markets. Our proprietary option flow model has been developed in-house to inform our judgement regarding how positioning across derivatives markets may influence the movement of Bitcoin.

The price of Bitcoin dropped below $20,000 early Monday morning. There are a series of weak support levels below the current price, namely, $19,250, $18,750, and $18,250. However, we believe there are no significant support levels until $15,000. Increased volatility is expected around $18,000 and $20,000. After the price recovers above $20,000, $20,500 is the first resistance level, while $21,000 to $24,000 are both stronger resistance zones. The market is still relatively volatile for the upcoming week due to negative GEX but is becoming more stable relative to last week, as buyers stepped in over the weekend to provide liquidity.
In summary, it is Greythorn’s opinion that Bitcoin will range between $15,000 and $21,000 based on our option flow model. Taking technical analysis into account, both techniques display that the market is likely to be flatter over the upcoming week than it was over the past week.
For an introduction to Greythorn Option Flow Model, please refer to our newsletter from 8 June 2022 .
REFERENCES
Squeeze Metrics, ‘The implied order book’, 2020.
The information contained within this piece is purely our opinion and should not be considered by readers to constitute any form of financial or investment advice. We encourage readers to conduct their own research into any financial product that they are interested in and Greythorn will not incur any liability for potential losses.


