

The cryptocurrency sphere, particularly its decentralised finance component, has undergone several seismic shifts and events over the past quarter. The number 8 cryptocurrency by market cap, LUNA, and 3rd largest stablecoin Terra, collapsed to essentially 0 over the course of 3 weeks. Several large, centralised institutions that were highly prevalent in DeFi are either insolvent or becoming insolvent. Every week it seems a protocol defrauds its users, a bridge is exploited, a lending service is overcome by bad debt, or a crypto asset manager is either liquidated or has exited the space and ‘gone to cash’.
This piece will provide an overview of the turmoil DeFi has experienced over the past month, why it can be considered crypto’s ‘credit crunch’, and how there are valuable investment opportunities should liquidity return to the space.
What is a Credit Crunch?
A credit crunch is when it suddenly becomes much more challenging to get a loan or access liquidity. Loan and liquidity providers become far more reluctant to lend because of the greater risk of defaults, naturally due to adverse political or economic conditions.
The particularly devastating aspect of a credit crunch is that it forces defaults and liquidations of parties that ordinarily would have survived despite difficult economic conditions should they have had access to short-term liquidity and financing.
An example of this includes the Dutch-American Lyondell Chemical (now known as LyondellBasell Industries). In 2007, the company took on a large amount of debt in an acquisition with Basell (another chemical company) to become the world’s most prominent public chemical corporation by assets.
With $18.5 billion in debt and $834 million due in 2008 on an operating profit of $1.28 billion, the company was highly leveraged and in weak capital condition leading into the great recession. Despite maintaining healthy operating earnings during the crisis which covered interest payments by 2.2x, the company could not raise additional debt or equity capital to meet its $834 million principal payment due to the ongoing credit crunch.
This overleveraged capital position forced the corporation to declare bankruptcy, and shareholders were entirely wiped out.
The company was forced into bankruptcy due to the lack of liquidity in capital markets. Had banks been willing to refinance the principal payment, we now know that the company would have survived the financial crisis. Since emerging from bankruptcy in August 2010 with a far less leveraged balance sheet, the company experienced a tailwind as global economic conditions improved. Its new shares increased 5x over the next four years, consistently growing dividends from 2010 onward.
A credit crisis and overall decrease in liquidity can doom businesses that need access to financing at the worst time.
DeFi’s Credit Crunch
Since early May, the DeFi space has seen a dearth of liquidity. Total value locked in DeFi has decreased from $195 billion on May 1st 2021 to $72.9 billion as of July 1 2022, a 63% decline.
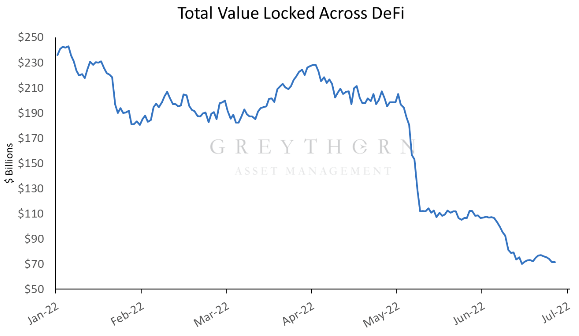
Year-to-date, liquidity in the DeFi space has declined from $236 billion to $72.9 billion, a 69% decline.
The carnage has been especially pronounced within smaller blockchains. Emerging layer two chains such as Metis and Astar are down approximately 78% and 85%. This period has also seen the total value locked in the Terra ecosystem decline 99.93%, from $28.6 billion to $24.2 million. The only chain to have retained much of its liquidity is Tron, likely due its algorithmic stablecoin USDD launching during this period.
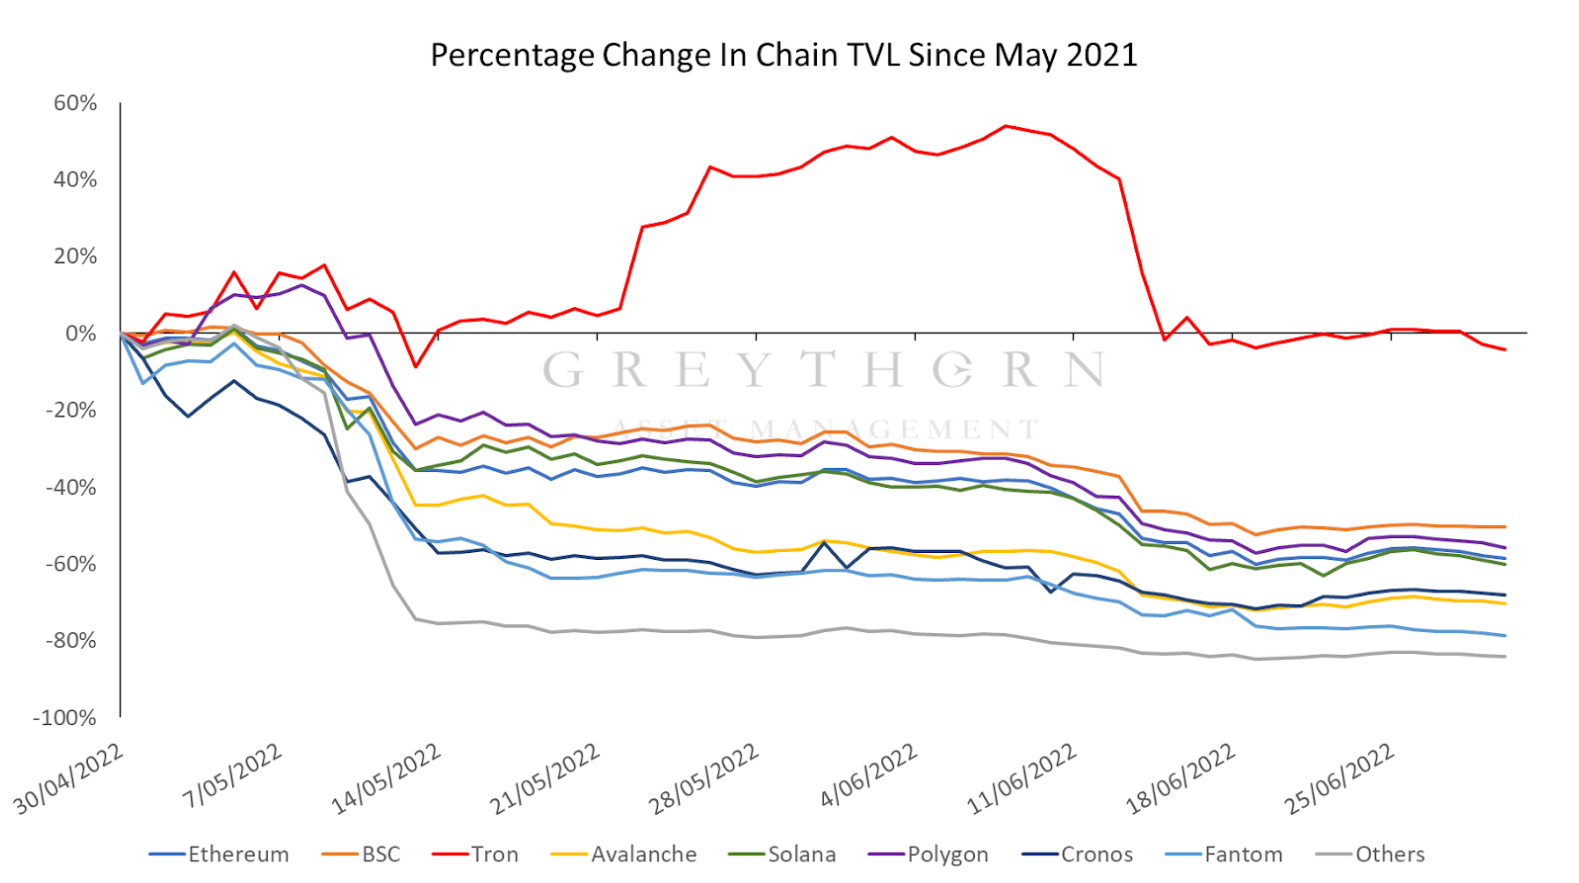
Figure 2: % Change in TVL across various blockchains (Source: DefiLlama 02/07/2022)
The large, established DEX’s have performed noticeably better, although they have also suffered significant declines in liquidity. Uniswap’s TVL has declined 41%, from $8.4 billion to $4.9 billion.
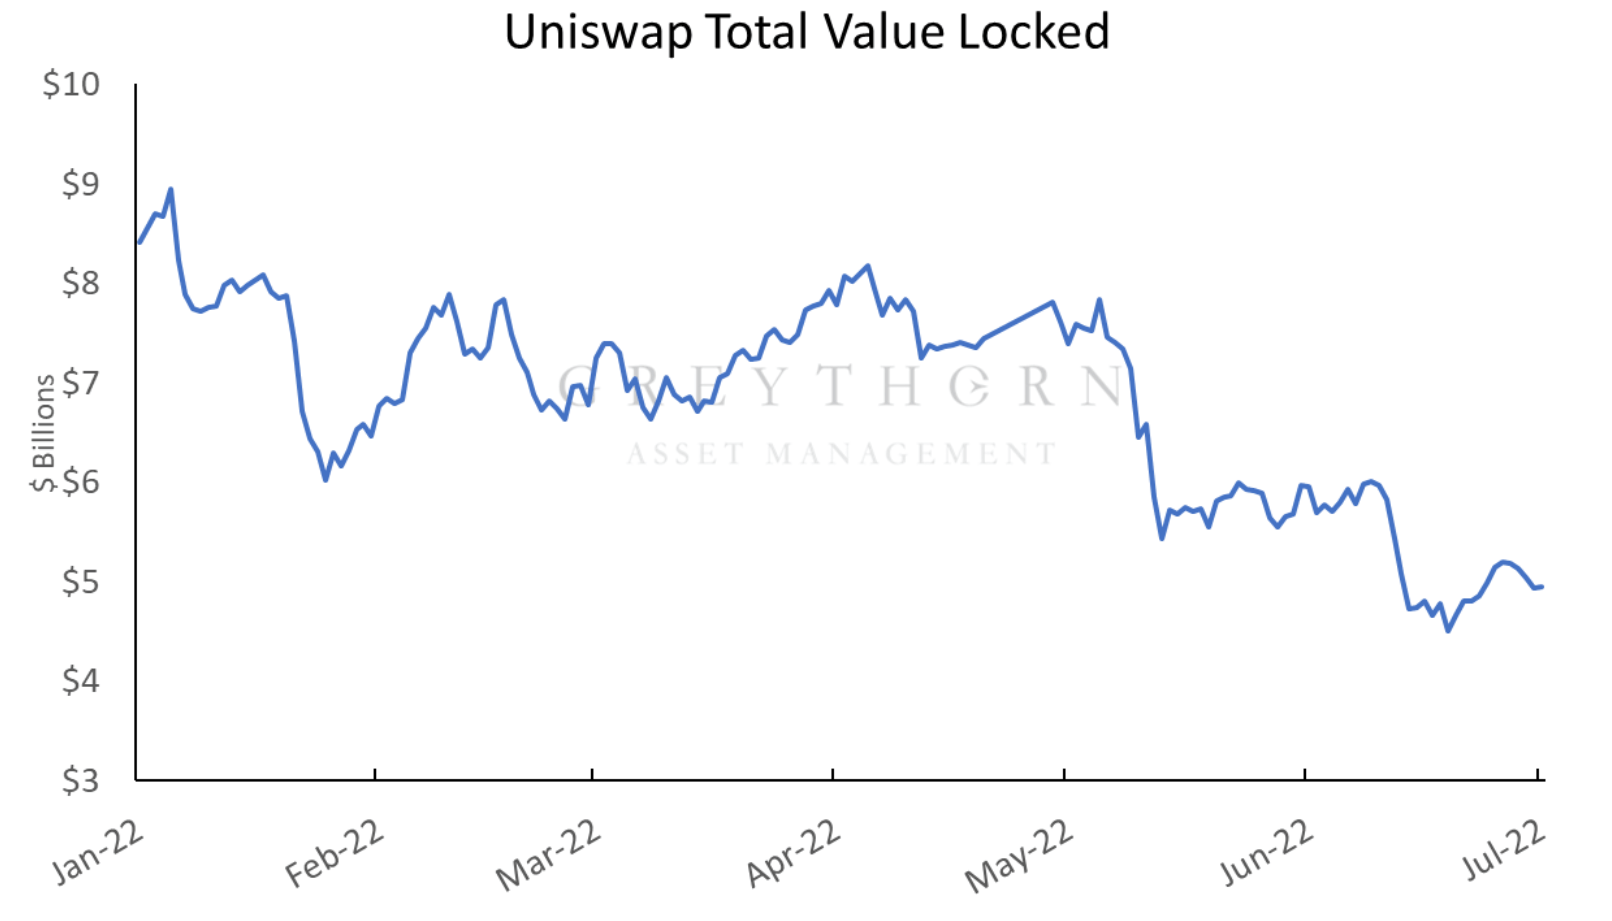
Figure 3: Uniswap TVL (Source: DefiLlama 02/07/2022)
This is despite the fact that from June 13 – June 20, the protocol generated greater daily fees than the entire Ethereum network (primarily due to the extreme volatility seen in crypto markets over the past weeks) .
The leading DeFi protocol on the BSC chain, PancakeSwap, has seen TVL decline 47% from $5.5 billion to under $3 billion. Despite this, the protocol continues to generate fees and improve its AMM design, with limit order functionality having become available since March.
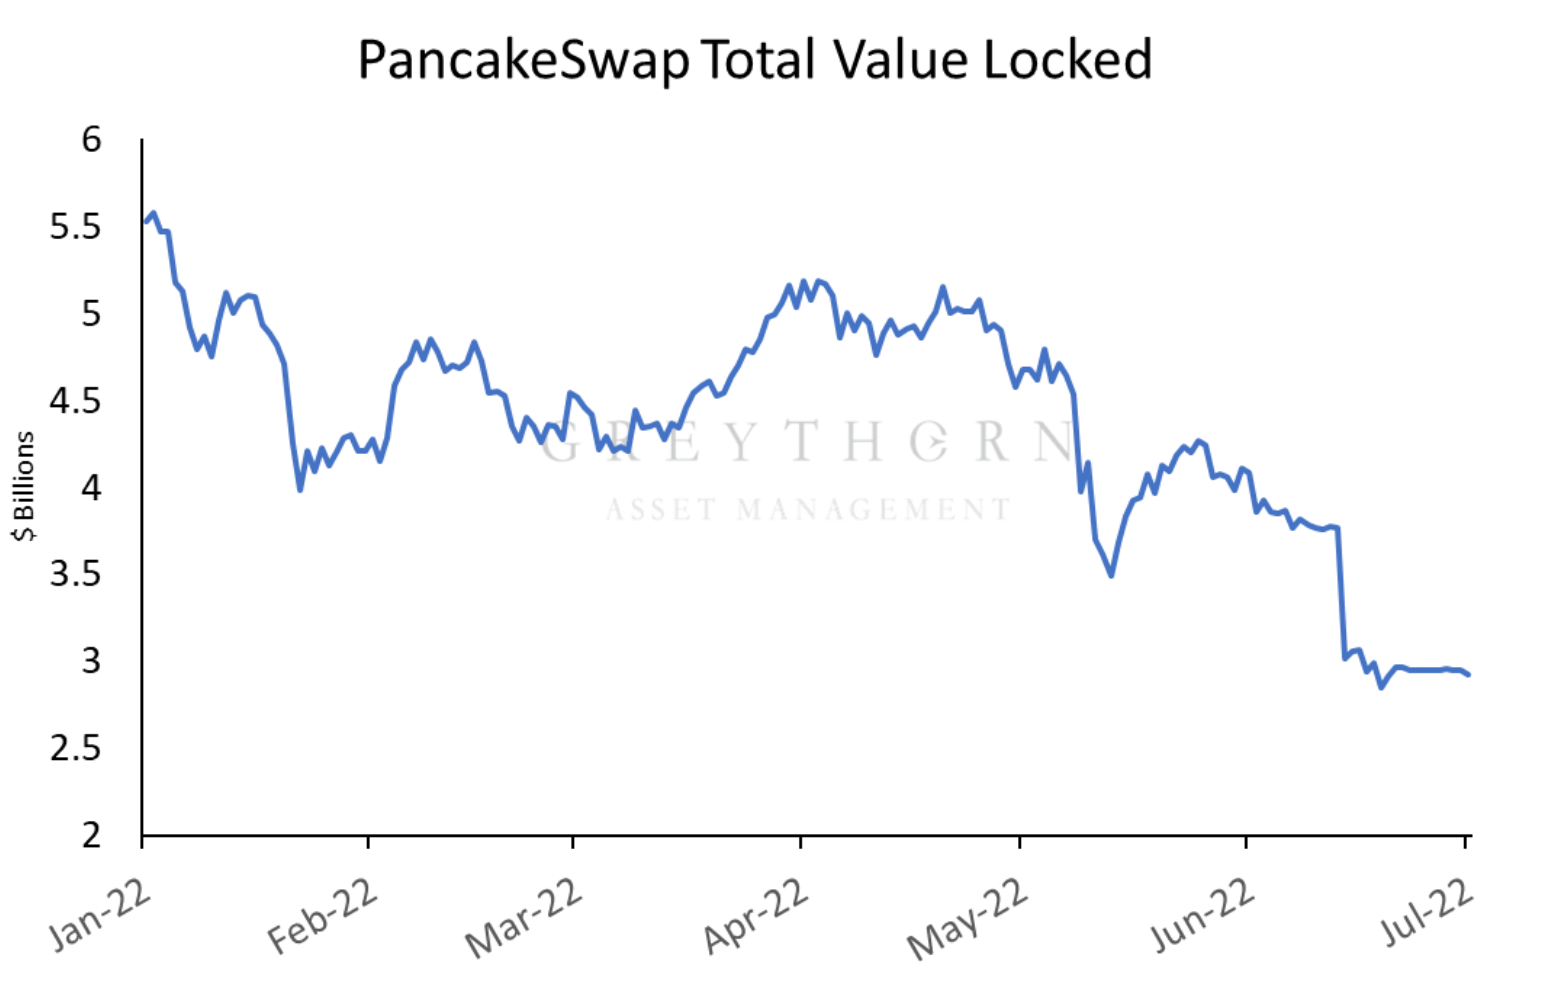
Figure 4: Pancakeswap TVL (Source: DefiLlama 02/07/2022)
Further, lending and borrowing activities within DeFi have dramatically slowed down. The leading loan protocol Compound has seen its total TVL decline 54%, with the volume of borrowed funds down from $2.4B to $812m.
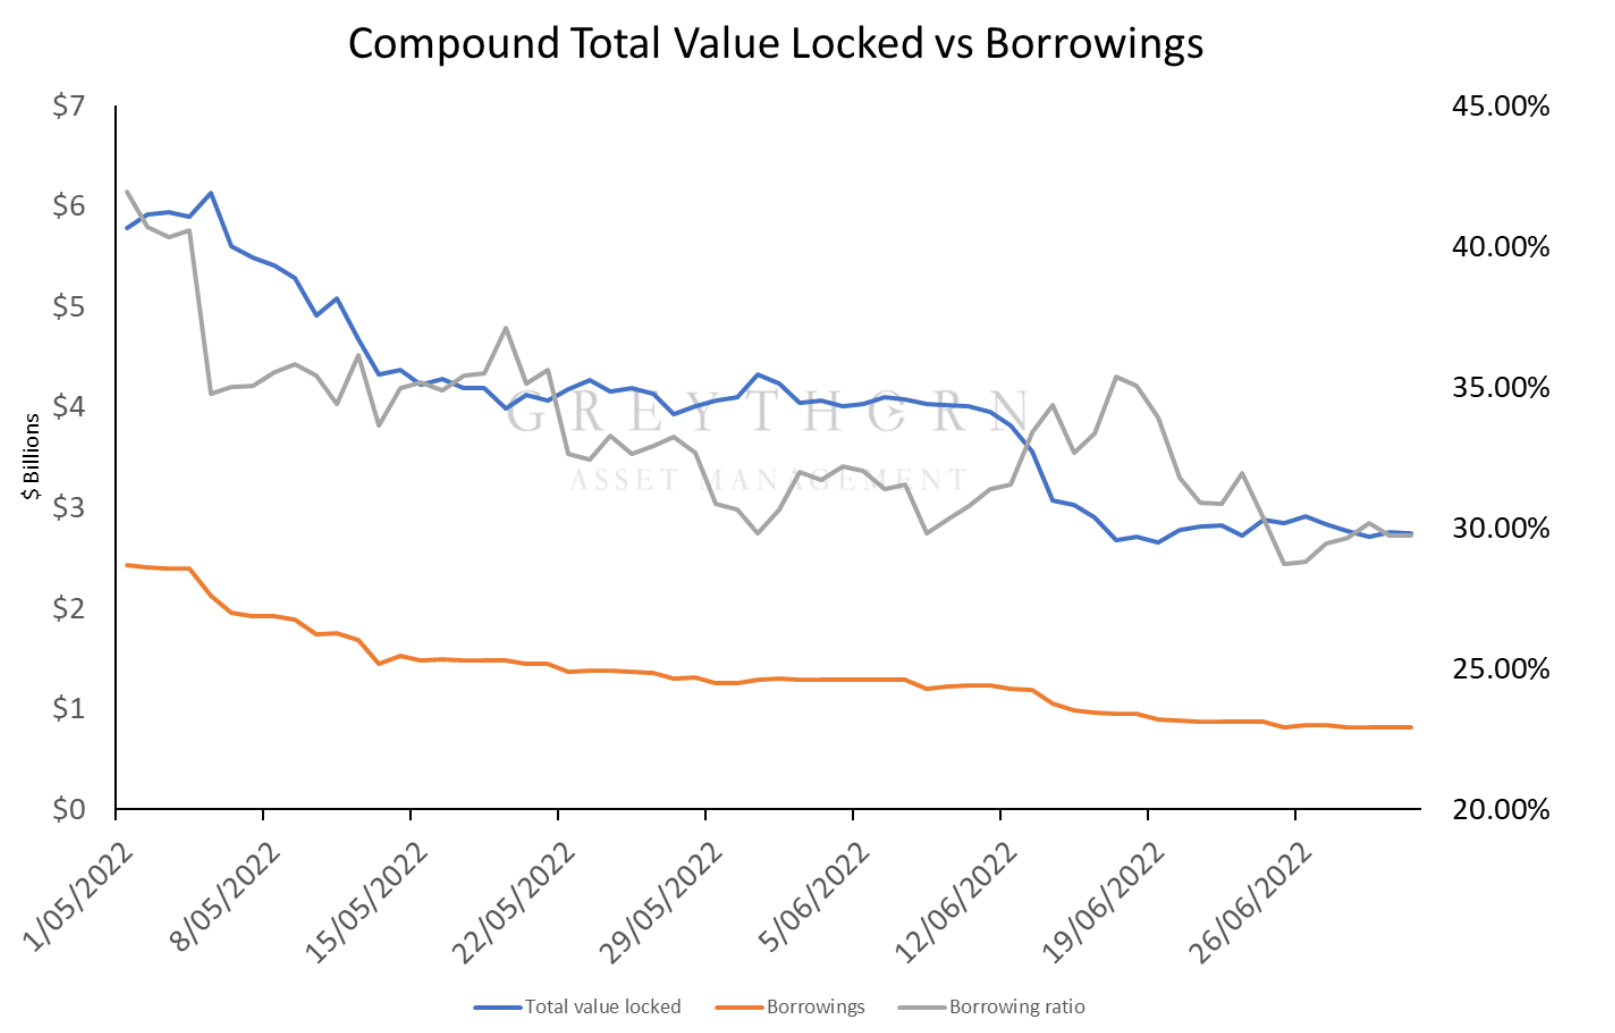
Figure 5: Compound Total Value Locked vs Borrowings (Source: DefiLlama 02/07/2022)
This declining ratio of funds borrowed to funds supplied on the protocol has resulted in liquidity providers being paid lower rates than the risk-free rate in traditional markets ( US 1-YR T-Bills currently offer a 2.64% yield ). Supplying stablecoins such as USDC provides a 0.35% interest rate, USDT offers 2.17%, and supplying Ether offers 0.10%. These current rates of return are too low to offset the smart contract and third-party risk.
Other lending protocols are experiencing the same problems, with Aave seeing TVL decline 56.6% with borrowings down 72.2%.
Solend’s TVL declined 64% and borrowings declined 70% since May.
The deleveraging events of the Terra blow-up and liquidations across CeFi such as Celsius & Three Arrows have seen liquidity flee the DeFi space. The next few years may see protocols or projects with good use cases leave the space simply due to a lack of financing and liquidity. Many protocols could see themselves becoming Lyondell Chemicals, inherently profitable businesses that fail due to a need for liquidity at the wrong time.
However, there is potentially great value in those protocols that continue to build throughout this crisis when liquidity returns to DeFi.
Lyondell Chemicals within DeFi
Less established DeFi protocols, particularly those built on alternative layer 1 blockchains, have experienced significant capital outflows. The leading AMM of the Fantom chain, SpookySwap, has seen TVL collapse 89% from $1.05 billion to $117 million YTD.
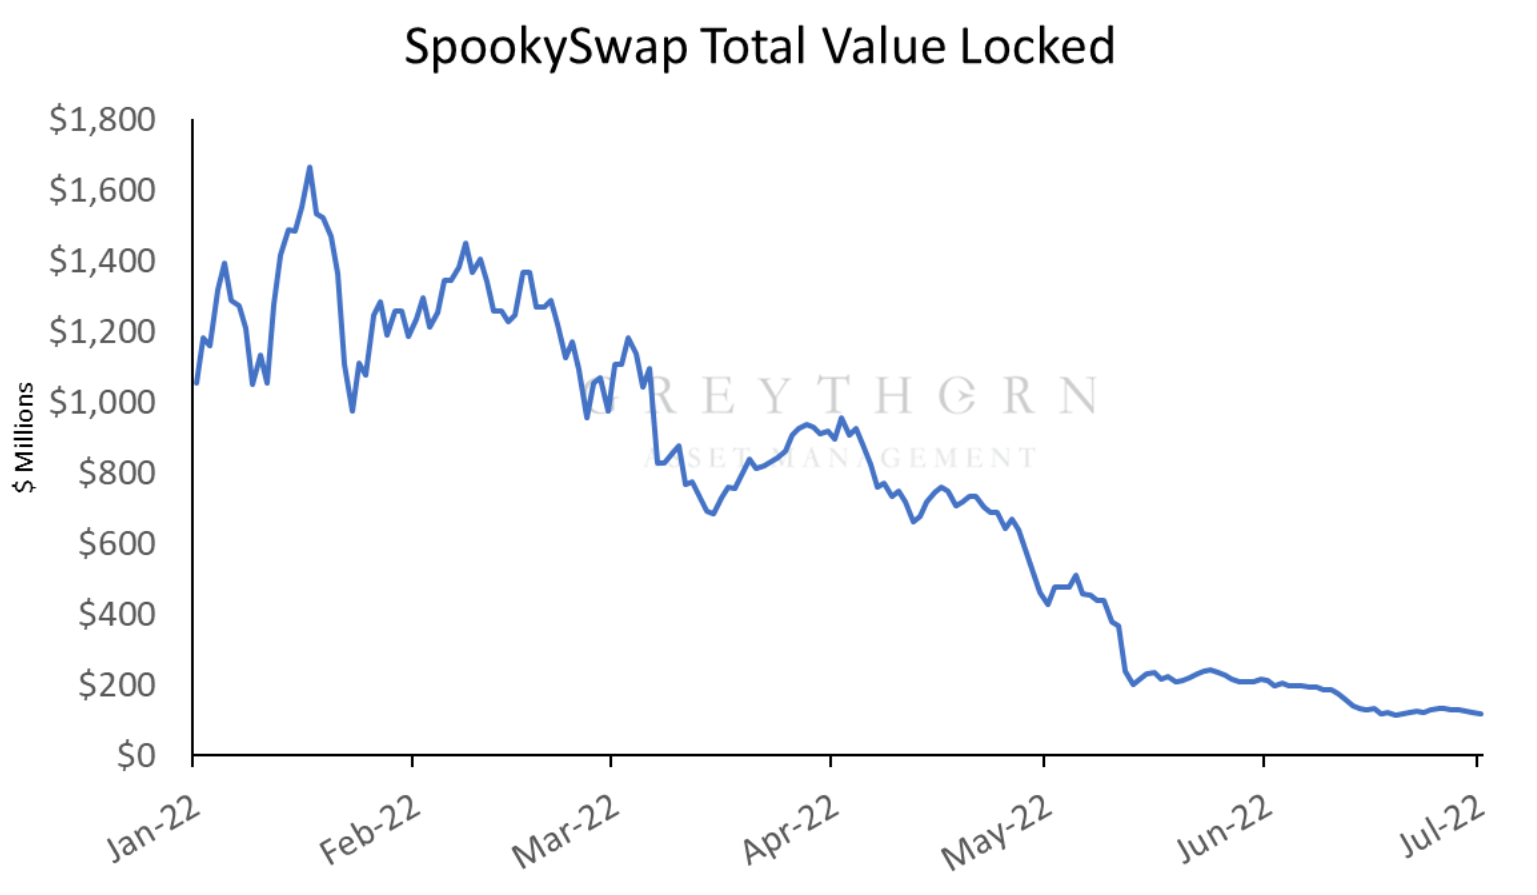
Figure 6: SpookySwap Total Value Locked (Source: DefiLlama 02/07/2022)
This decline follows that which has been observed across the broader Fantom ecosystem, where TVL has decreased 83%. The decline in SpookySwap’s liquidity has occurred despite the fact that its trading fee of 0.20% on users ranks among the lowest in DeFi, beating PancakeSwap’s 0.25%, Trader Joe’s 0.30%, and Uniswap’s 0.30%.
Similar to the case of Lyondell Chemical, at its core, SpookySwap remains a profitable protocol at its core, generating median daily fees of $13.673 million, with volatile days generating $100-113 million.
Liquidity providers have been rewarded with comparatively high APRs during this period, with FTM-ETH pairs generating an APR of 24.2% and BTC-ETH pairs generating 9.52%, among others. 70%+ of this APR is provided by the organic distribution of trading fees, with the emissions of the $BOO governance token contributing the remainder.
However, due to a liquidity crunch with the broader cryptocurrency market, particularly within the Fantom ecosystem, the fees earned by SpookySwap governance token holders have fallen dramatically. At the peak for normalised trade volume within Spookyswap from December 2021 to January 2022, the exchange was processing $126 million to $713 million worth of daily transactions.
Governance token holders received a fee of 0.03% of this volume, earning $37,800 to $214,000 daily. As of 04/07/2022, daily volumes have diminished to $11.7 million, earning $3,510 for governance token holders each day.
The decline in TVL and trading volume within SpookySwap has severely limited the fees provided to $BOO token holders and has resulted in the price of $BOO decreasing from its high of $39.60 in late January 2021 to $2.08 as of July 2022.
The lack of liquidity in the Fantom ecosystem, similar to the lack of financing available to Lyondell Chemical in 2008, could see the SpookySwap decentralised exchange protocol fail despite the underlying project remaining useful and profitable.
Post-Crisis Recovery
As mentioned above, following its emergence from bankruptcy in April 2010 with a de-levered balance sheet and a wave of new liquidity from banking institutions that central banks and monetary reform had recapitalised, Lyondell Chemical performed very well.
From April 2010 to September 2014, purchasing a share in the company would have delivered an annualised return of 98%, far outperforming the broader equities market during this period.
It is possible that should liquidity return to many DeFi protocols, their associated governance tokens will be entitled to significant cash flows and may see substantial increases in value.
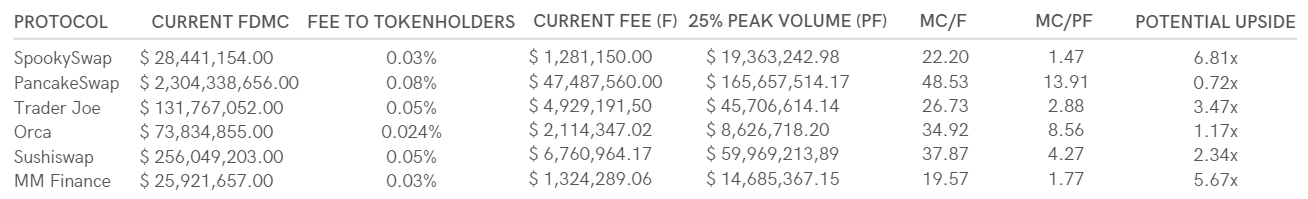
Figure 7: Current Fully Diluted Market Capitalisations of several AMM’s comparing their current fees to tokenholders vs 25% of their peak fees. Potential Upside reflects the hypothetical increase in the value of each protocol if the associated governance token were to trade at 10x its ‘25% of Peak volume’ fees. Source: (See Appendices)
As shown in the table above, DeFi protocols trade at wide valuation discrepancies. PancakeSwap is regarded as one of the leading and safer AMM’s within the BSC ecosystem, which is reflected in it trading at a multiple of 48.5x fees.
Interestingly, PancakeSwap trades at a higher multiple than its peers even though it devotes more of its trading fees towards tokenholders, effectively distributing 0.08% of the trading volume to $CAKE holders. This is important in that PancakeSwap theoretically has less scope to increase the accrual of fees to $CAKE holders than other protocols do, i.e. its ‘potential’ to distribute fees is less than that of SpookySwap or MM Finance (both at 0.03%). Such a situation across traditional assets would generally attract a comparatively lower valuation multiple.
On the other hand, MM Finance, the leading DEX of the Cronos ecosystem, trades at a significantly lower valuation multiple (19.57) than $CAKE. This may be due to the Cronos blockchain not being as highly regarded as the BSC blockchain with limited liquidity to bridge to Cronos from other chains.
SpookySwap, MM Finance, and Trader Joe have the most significant potential upside of the protocols selected. Their relatively lower MC/F ratios compared to their peers (22.2, 19.57, and 26.73, respectively) and the dramatic increase that would be seen in earned fees if liquidity were to return to 25% of the protocol peak (ranging from 15x for Spookyswap to 9.27 times for Trader Joe) render them as promising protocols to monitor.
Just as the outlook for purchasing a previously bankrupt chemical company in 2010 would have been both murky and frightening at the time, building a position in the native tokens associated with these protocols would likely be equally as frightening. The best performing token from the list above, $CAKE, is down -93% from its all-time high, with the other tokens ranging from -95% to -98% declines.
There is no certainty that liquidity will return to DeFi. Even if liquidity returns, there is no guarantee that these protocols capture even a fraction of their previous trading volumes.
While the potential upside given the assumptions above may be attractive, there is always the possibility that a new, more innovative protocol emerges and takes liquidity from the others.
Conclusion
This piece explored the current liquidity situation throughout DeFi, allegorising the situation to that of the 2008 credit crunch and how that environment was able to bankrupt businesses such as Lyondell Chemical that were operationally profitable.
Almost every blockchain has seen its total value locked decline by 50-85%. There is a lack of borrowing, and trading volumes on decentralised exchanges have plummeted from their highs.
While the situation appears dire, opportunities will present themselves as the market deleverages & liquidity begins to improve. Just as Lyondell Chemical delivered significant returns to shareholders in the wake of its bankruptcy, the protocols that earn tangible cash flows, and have a superior product, could experience substantial increases in value should liquidity return.
The future of DeFi appears bleak, but those projects that continue to
grow and innovate may deliver strong returns to tokenholders.
References
Defi Llama. < https://defillama.com/ >.
Form 10-K Lyondell Chemical Co, 2007, < https://sec.report/Document/0000842635-08-000019/ >
LyondellBassel 2010 Annual Report, < https://www.lyondellbasell.com/globalassets/investors/company-reports/2010-annual-report.pdf >.
LyondellBassel Industries N.V, Historical Data, Yahoo Finance, < https://finance.yahoo.com/quote/LYB/history?p=LYB >
LyondellBassel U.S. Units file for bankruptcy, Reuters, 2009, < https://www.reuters.com/article/us-lyondellbasell-bankruptcy-idUSTRE5056YF20090107 >.
U.S. 1 Year Treasury Bill, Marketwatch, <https://www.marketwatch.com/investing/bond/tmubmusd01y?countrycode=bx>.
Appendices
(Figure 7)
- Data from CoinGecko.
- Current annualised fee based on 14 day average volume as of 4/07/2022.
- Pancakeswap docs – 0.25% trading fee, 0.17% to LP, 0.03% to Treasury, 0.05% to CAKE buyback and burn.
- TraderJoe docs – 0.3% trading fee, 0.25% to LP, 0.05% to sJOE staking.
- Orca docs – more complex fee structure with lower fees for stable swaps compared to others. Assumed 50% of trades involve stable swaps for model. Pool 0.3% trading fee, 0.25% to LP, 0.04% to Treasury, 0.01% to Impact Fund. Stable Pool, 0.07% total fee, 0.06% to LP, 0.008% to Treasury, 0.002% to Impact fund.
- Assumed total fee to treasury of 0.024%.
- Sushiswap docs – 0.3% trading fee, 0.25% to LP, 0.05% to xSUSHI holders.
- MM Finance docs – 0.17% trading fee, 0.1% to LP, 0.05% to METF Treasury as backing for METF, 0.02% to MM Finance Treasury, assumed 0.03% to incorparate buybacks from MMF/CRO LP (protocol owned liquidity).
Important notice and disclaimer
This presentation has been prepared by Greythorn Asset Management Pty Ltd (ABN 96 621 995 659) (Greythorn). The information in this presentation should be regarded as general information only rather than investment advice and financial advice. It is not an advertisement nor is it a solicitation or an offer to buy or sell any financial instruments or to participate in any particular trading strategy. In preparing this document Greythorn did not take into account the investment objectives, financial circumstance or particular needs of any recipient who receives or reads it. Before making any investment decisions, recipients of this presentation should consider their own personal circumstances and seek professional advice from their accountant, lawyer or other professional adviser.
This presentation contains statements, opinions, projections, forecasts and other material (forward looking statements), based on various assumptions. Greythorn is not obliged to update the information. Those assumptions may or may not prove to be correct. None of Greythorn, its officers, employees, agents, advisers or any other person named in this presentation makes any representation as to the accuracy or likelihood of fulfilment of any forward looking statements or any of the assumptions upon which they are based.
Greythorn and its officers, employees, agents and advisers give no warranty, representation or guarantee as to the accuracy, completeness or reliability of the information contained in this presentation. None of Greythorn and its officers, employees, agents and advisers accept, to the extent permitted by law, responsibility for any loss, claim, damages, costs or expenses arising out of, or in connection with, the information contained in this presentation.
This presentation is the property of Greythorn. By receiving this presentation, the recipient agrees to keep its content confidential and agrees not to copy, supply, disseminate or disclose any information in relation to its content without written consent.