Technology has a profound influence on the world around us. It impacts our day-to-day life, work, health, and relationships. Since the dawn of the industrial revolution in the 1760s, the pace of innovation has proceeded exponentially. New processes and ideas rapidly gain prominence and have profound impacts approximately every decade.
Technology is fascinating, and its mysterious possibilities can result in people (particularly investors) becoming overly zealous about the future of any one technology to irrational levels. This phenomenon often manifests itself in the prices of assets connected to an emerging technology.
This article briefly explores the history of several key technological developments, how they have changed the world, how asset prices initially reacted to the development and what economic value was created for early-stage investors.
1. The Railway Mania of the 1830s-1840s
While speculative bubbles had existed before the British railway mania, such as the Dutch Tulip Bubble of the 1630s and the South Sea’s Bubble of 1720, these extraordinary events were driven much more by financial innovation than technological innovation. The first tech bubble with documented asset prices was Railway mania.
The world’s first modern inter-city railway was opened in 1830, connecting the cities of Liverpool and Manchester in England. At the time, railways were cutting-edge technology. After thousands of years of horses being the fastest way to travel overland, the locomotive almost instantly became a far more efficient mode of transportation. The average horse could travel around 80.5km in one day, or a maximum speed of 19.3 km/h over short distances. In comparison, locomotives ran at 48 km/h over long distances in 1830, improving to consistent speeds of 120 km/h by 1850. Trains fundamentally changed economics and logistics within the UK, dramatically reducing the costs to ship goods and people.
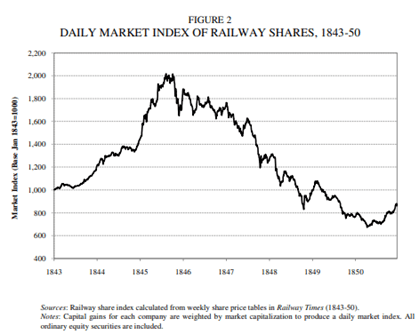
Investors of the time were understandably excited by the prospect of how railroads could revolutionise transport around the world. Railroad companies were promoted in newspapers as foolproof investments, and the general public could purchase shares with the equivalent of 10x leverage for the time. Parliament authorised 59 new railways, with many Members of Parliament being heavy investors in the companies. According to Campbell et al, Railway share prices saw a 100% rise from 1843 to 1845 before falling 65% by early 1850. The mania even drew in celebrities of the time; Charles Darwin and the Brontë sisters were railway shareholders.

Source: ‘The Greatest Bubble in History’: Stock Prices during the British Railway Mania’ by Campbell, Gareth and Turner, John (2010).
Campbell et al further explain how by the end of 1845, there had been 221 new railway companies listed. By 1850, only 60 of these companies were still listed on the London Stock Exchange. This mass delisting was due to the Bank of England increasing interest rates in late 1845 and capital beginning to flow out of the railways.
Many of these companies either went bankrupt or did not obtain authority or exercise authority to construct a railway.
While the thoughts of many investors of the time that railroads would change the world would eventually come true, and the power of the technology was ratified moving forward, not all individual companies could survive and flourish. Companies such as the Great Northern Railway and the Northeastern Railway survived the fallout and acquired other lines for a fraction of what it cost to build them. In all, although data surrounding this is limited, it appears that a winner takes all economic equilibrium takes place. Most of the capital returns to investors from this era came from only a tiny fraction of the railway companies established.
2. The British Bicycle Mania of 1895-1898.
The British bicycle bubble of the late 1890s is a lesser-known technology-driven boom and bust. The first successful ‘safety bicycle’ or modern bicycle design was invented by John Kemp Starley, an English inventor, in 1885. This design was combined with new processes for producing the steel tubes used in bicycles and the adoption of new tyre designs, which led to a significant increase in British productive capacity for bicycles and a rapid rise in demand. According to William Quinn (2016), existing bicycle producers struggled to meet demand, and there was a massive flow of capital into new and existing cycle, tube and tyre companies from 1896 onwards.
Twenty-nine new companies in the bicycle space went public in 1895, and 128 companies with a combined nominal value of £15.5 million (£2,123 million or $3.5 billion today) were listed in 1896 . Bicycles once again represented a considerable technological advancement in personal transportation and were fashionable at the time.
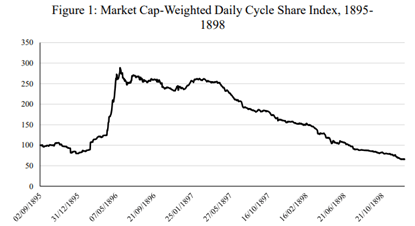
An index of bicycle companies collated by Quinn using data from contemporary newspapers indicated that the industry saw share prices rise by over 200% in early 1896. Furthermore, the Financial Times reported on April 22 nd , 1896, that the market had ‘gone mad’ following significant price increases in several cycle shares. The boom did not last however, as bicycles ‘fell out of fashion’, competition entered the market from cheaper American cycle manufacturers, and the bicycle was eventually rendered obsolete as the preeminent form of personal transportation with the introduction of the Ford Model T in 1908. Ultimately, 122 of the 141 cycle companies examined by Quinn declared bankruptcy, were reconstructed or wound up, and the cycle index fell 76% from its peak to 1898.

Source: ‘Technological revolutions and speculative finance: Evidence from the British Bicycle Mania’ by William Quinn, 2016.
The vast majority of returns to investors from companies involved in the bicycle industry came from 7 of the 157 companies, Dunlop and Palmer (which initially produced bicycle tires and branched into tyres for other vehicles), Rudge-Whitworth and Triumph (who moved into producing motorcycles), Rover and Riley (moved into producing cars) and only one pure-play bicycle company, Rayleigh, which became globally successful following the bubble.
Only 1 of the 157 bicycle-related companies were able to deliver strong returns to investors over the long term.
3. The Dot Com bubble of the late 1990s.
While there were other major technological revolutions and associated bubble-like behaviour in stock prices during the 1920s (automobiles, radio, home appliances), these times were driven primarily by increasing financial leverage and macroeconomic factors rather than purely by the technology itself. Similarly, the high asset prices seen in Japan during its economic bubble from 1986 to 1991, while influenced by new technology and advancement in digital audio, cameras, and televisions, were not primarily driven by this technology but by monetary policy and financial factors. The ‘90s Internet bubble can mainly be viewed as a tech bubble.
The development of the Internet and the release of web browsers in the early 1990s saw an enormous boom in the number of people using the Internet. In 1995 there were 16 million Internet users worldwide. By 2000 this number had increased to 304 million.
Investors understood the Internet’s potential well, which resulted in a buying frenzy of Internet-based stocks to the point of ‘irrational exuberance’ as stated by then-Federal Reserve chairman Alan Greenspan in late 1996. New high-tech Internet companies were starting up every day, and the public Internet companies were being valued on metrics such as traffic growth to their websites and ‘clicks’ instead of traditional metrics such as cash flow generation or net income growth.
Famous examples of dot-com busts include Pets.com, a company that sold pet food online. Pets.com would go public in early 2000 at an initial market cap of $290 million with a growth-focused strategy intent of using heavy advertising to attract customers. In Pets.com’s first fiscal year, the company took in revenues of $619,000 while spending $11.8 million on advertising alone. In addition to this, over the 280-day life of the company, it would sell its merchandise at approximately one-third the price it paid to obtain the products, and it would spend $1.2 million on a super bowl advertisement in January 2000. Initially expected to generate $35 million in sales in 2000, the company was priced at 8.28x sales in an industry where the profit margins of established pet food companies ranged from 4-6%! Ultimately, pets.com would file for bankruptcy nine months after its IPO after failing to raise additional equity capital.
A second example includes the technology company Cisco, the leading company in Internet infrastructure of the time, which supplied networking equipment to telecom and Internet companies. Cisco was seen as the ‘shovel-seller’ during the dot com gold rush, and it was viewed as one of the big winners of the future. At its March 2000 peak, Cisco would be the most valuable corporation globally by market cap at $546 billion, and it would be valued at 201x earnings and 176x cashflow. Ultimately, as the bubble burst, Cisco would fall 80%. Although Cisco would survive the dot com bust, its share price would never again reach its 2000 highs of $79.56, with its stock price currently at $48.96 22 years later.
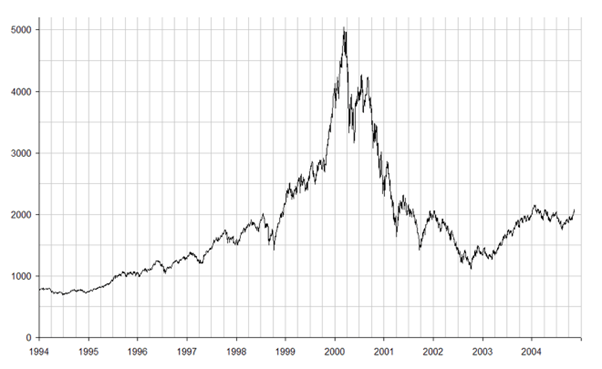
Between 1995 and 2000, the NASDAQ Composite stock market index rose 400% and reached a price-earnings ratio of 200. At its peak, the NASDAQ hit 5,048 but following interest rate rises in early 2000, the beginning of a recession in Japan, and a series of antitrust lawsuits against Microsoft (among other factors), the bubble would begin to burst. The Nasdaq would fall 78% between 2000 and 2002, closing at 1114 in October 2002. The Nasdaq would not reach its 2000 highs again until early 2015.
NASDAQ Composite Index (1994-2005)

Source: Trendfollowing.com
Similar to the examples of past Railway and Bicycle bubbles, only a few companies would fulfill the promise that investors saw in the Internet. Amazon, Apple, and Microsoft would be the prominent companies of the bubble that would deliver huge returns to investors. Of the top 15 companies in the NASDAQ in 2000 only Microsoft remains in the top 15 today in 2022. Even so, an investor who purchased shares in Microsoft at its dot com peak of $60 per share would not break even on their principal investment until late 2016, 16 years later!
What can investors take away from these three historical bubbles?
The examples of the railway, bicycle, and Internet bubbles are similar in that investors became overly optimistic about the prospects for the companies involved in a new and emerging technological revolution. While the developments of the railroad and Internet would eventually meet and even surpass the lofty expectations investors imposed on them, most investors would not realise great returns from investing in the space.
Many technologies experience ‘winner take all’ economics. In the case of the railroad companies, size confers economies of scale that allow more prominent companies to outcompete smaller ones by offering lower rates for transportation. In modern technology, such as e-commerce and software, we have experienced how network effects, switching costs, and scale advantages have allowed certain industries to become highly concentrated. Apple and Google largely dominate the market for phones. Google is the winner in search. Amazon leads in e-commerce, and Meta dominates social networking.
To win when investing in technological revolutions, an investor must pick the one or two winners out of potentially hundreds and be willing to stick it out through considerable declines in the asset prices of these winners. For example, Amazon would fall 90% between 1999 and 2001 but would then experience a 250x in value from 2002 to 2022 with drops of 60% in 2008, 30% in 2018, and 38% from its 2021 heights until today.
How many investors would be able to ride out this volatility and stick to their conviction in any company or asset? In the case of Amazon, it has virtually only been its founder Jeff Bezos, his ex-wife Mackenzie Scott and likely current CEO Andrew Jassy who have held onto their shares since 1997.
It is essential, albeit challenging, to learn from the experiences of bubbles of the past and remember that even where a technology is ground-breaking and going to change the world, the price you pay to participate in said change must be rationally determined.
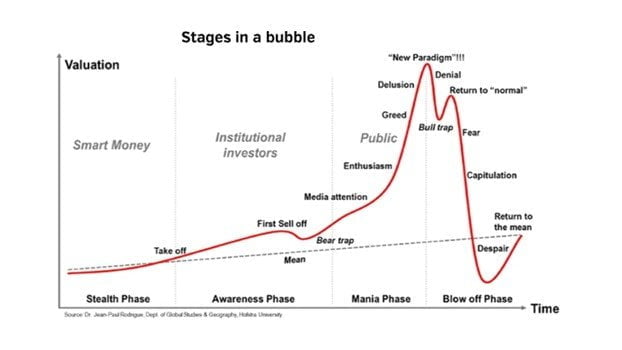
Similar to the chart below, many bubbles experience a similar trajectory. An untested technology becomes more aware in the mind of investors and the public, and the resulting enthusiasm for its future grows far in advance of its fundamentals. The key is to rationally determine what stage a technology is in, and to act accordingly.

Technological revolutions to come
The emergence and growth of technologies can frequently be rapid and unforeseen. However, sometimes emerging technologies appear transparent in their capacity to disrupt the world.
At Greythorn, we believe that cryptocurrencies and the world of decentralized finance represent a sea change and that their potential to change the world is immense. However, we have learned from past technological revolutions exactly how difficult it is to pick the one winner in any market and have adopted strategies to deliver strong returns to our investors no matter who wins.
Today Bitcoin and Ethereum represent approximately 60% of the cryptocurrency market cap, and Ethereum is the market leader in decentralized financial technology. Still, it is impossible to tell if this will be the case in five or ten years. Of the top ten cryptocurrencies in December 2016, only three (Bitcoin, Ethereum, and Ripple) remain in the top ten today.
We believe the current weakness across digital asset markets is likely to remain given the macro environment. Our team has taken the necessary steps to ensure that we are positioned appropriately for this possibility.
While the crypto market did experience an initial coin offering (‘ICO’) bubble in late 2017, we believe that a future bubble in digital assets is likely to occur at some point in the future and have taken steps to prepare for this eventuality.
The emerging technology of cryptocurrency is fascinating, and its developments will undoubtedly influence the world of the future. Investors must learn from the bubbles of the past to move forward and critically evaluate any new projects or technologies as they materialise.
References
Gareth Campbell and John D. Turner, ‘Dispelling the Myth of the Naive Investor during the British Railway Mania, 1845-1846’, 2012.
Jeremy Siegel, ‘Stocks for the Long Run’, 1994.
Carlota Perez, ‘Technological Revolutions and Financial Capital: The Dynamics of Bubbles and Golden Ages’, 2003.
Lubos Pastor and Pietro Veronesi, ‘Technological Revolutions and Stock Prices’, 2005.
Carlota Perez, ‘The double bubble at the turn of the century: technological roots and structural implications’ 2009.
Lubos Pastor and Pietro Veronesi, ‘Was there a NASDAQ Bubble in the late 1990s?’, 2004.
William Quinn, ‘Technological revolutions and speculative finance: Evidence from the British Bicycle Mania’, 2016.
Begin to Invest, ‘Lessons from the Pets.com downfall – What’s the Difference Between a Bad Idea and a Good Idea That’s Early?’, 2020.
Financial Time, ‘Investors should not dismiss Cisco’s dot com collapse as a historical anomaly’, 2021.
The information in this post is provided for information purpose only. It does not constitute any offer, recommendation or solicitation to any person to enter into any transaction or adopt any hedging, trading or investment strategy, nor does it constitute any prediction of likely future movement in rates or prices or any representation that any such future movements will not exceed those shown in any illustration. Users of this document should seek advice regarding the appropriateness of investing in any securities, financial instruments or investment strategies referred to on this document and should understand that statements regarding future prospects may not be realised. Opinion, Projections and estimates are subject to change without notice.
Greythorn Asset Management is not an investment adviser and is not purporting to provide you with investment, legal or tax advice. Greythorn Asset Management accepts no liability and will not be liable for any loss or damage arising directly or indirectly (including special, incidental or consequential loss or damage) from your use of this document, howsoever arising, and including any loss, damage or expense arising from, but not limited to, any defect, error, imperfection, fault, mistake or inaccuracy with this document, its contents or associated services, or due to any unavailability of the document or any thereof or due to any contents or associated services.


