Research · AI & compute
AI's First Real Ledger: The Growth Is Real — Who Pays for It?
Key Insights
- The growth is real — and usage-priced. Anthropic's H1'26 revenue was $16.286B, versus $1.163B in H1'25 (S-1 summary statements of operations); about 80% was consumption-based (MD&A).
- Unit economics improved, but the stack is still compute-heavy. Compute & infrastructure fell from 201% of revenue in H1'25 to 55% in H1'26; GAAP operating loss narrowed to $693M, while Adjusted Operating Income flipped to +$1.618B (S-1).
- Cash is not the GAAP story. Operating cash flow was +$3.9B and financing cash flow +$110.8B in H1'26; the $80.7B net loss is dominated by a $72.4B non-cash fair-value remeasurement of convertibles and related instruments (S-1).
- The bill is multi-hundred-billion and largely fixed. Partner disclosures include a Broadcom 2026 Lease Arrangement of about $125.2B (five-year, non-cancelable except default) and aggregate Broadcom lease rents of about $161.2B; Amazon / Google / Microsoft minima alone exceed $269B. Note subsequent events cite ~$417B post-YE2025 agreements plus an estimated $125–150B more for 2028–31 capacity — the $542–567B range circulating in media is a sum of those Note figures, not a single printed MD&A headline (S-1; Fortune; CNBC).
- Revenue quality has an asterisk. Anthropic itself estimates 5–7% of revenue in the nine months ended 30 Sep 2026 came from customers later found to violate usage policy or commercial terms (MD&A).
Opening Remarks
For four years the frontier-lab debate has been fought with anecdotes, leaked ARR slides and valuation rumours. On 26 October 2026, Anthropic, PBC filed a Form S-1 with the U.S. SEC — proposed Nasdaq ticker ANT — and, for the first time, put audited and reviewed numbers on the table. That is the event. Not the marketing language about an "age of miracles"; the ledger.
Our angle is deliberately skeptical. Hyper-growth is no longer in dispute. The open question is whether a business whose customers can mostly walk away, while its compute bill is largely fixed for years, can keep converting silicon into free cash after the novelty premium fades. Nothing below is a recommendation to buy or sell; it is a reading of the filing.
Background: From Lab to Public Benefit Corporation
Anthropic was founded in 2021 by a group of researchers who left OpenAI, led by CEO Dario Amodei and President Daniela Amodei. It is organized as a Delaware public benefit corporation (PBC). The S-1 describes an unusual governance stack: a Long-Term Benefit Trust (LTBT) that generally elects and can remove a majority of the board via Class T stock; a Founder LLC holding Class F stock with concentrated voting influence for the seven co-founders; Class A (one vote) for the public float; and Class N (generally non-voting) for strategic partners. The company states that this structure "has no direct public company precedent" and may deter unsolicited change-of-control.
As of 30 September 2026, Anthropic had about 5,300 employees and cites over 50% of the Fortune 500 and over 30% of the Global 2000 as customers in some form (S-1 Business). Annual revenue scaled from $41M (2023) to $386M (2024) to $4.585B (2025) before the H1'26 step-change (summary statements). Cumulative capital raised reached $141.1B by 30 June 2026, with cash and cash equivalents of $112.4B and short-term investments of $19.3B on that date (S-1).
Use of IPO proceeds is standard boilerplate: general corporate purposes, compute and infrastructure, hiring, and possible acquisitions — with share count, price and net proceeds still blanked in the prospectus (Use of Proceeds). Selling stockholders will receive none of the company's use-of-proceeds narrative; their economics are separate.
Product and Technology
The product stack is the Claude family — four model classes named in the filing as Mythos (including Fable), Opus, Sonnet and Haiku, positioned along a capability–cost–speed curve (MD&A). Applications such as Claude Code and Claude Cowork are framed as enterprise workflow multipliers; the company claims that in September more than 90% of contributions to its own codebase were written by Claude (S-1) — a striking operational claim, but one that also underscores how tightly product velocity is coupled to internal compute.
On the infrastructure side, Anthropic emphasizes a multi-chip, fungible compute pool across AWS Trainium, Google TPUs, NVIDIA GPUs and AMD GPUs, with a proprietary orchestration layer routing workloads for price/performance (S-1). Distribution runs through Anthropic's own channels and the three major CSP marketplaces — AWS, GCP and Azure — which accounted for about 48% of H1'26 revenue (Risk Factors / MD&A). A newer pillar, Anthropic Direct, separates long-lead data-center capacity from accelerator leases (notably with Broadcom) in an attempt to own more of the stack economics over time.
The technology story is coherent. It is also capital-intensive by design: every capability jump presupposes another wave of committed silicon.
Business Model and Financials
Revenue mix. Pay-for-intelligence (token-metered, consumption-based) is the core. Consumption-based revenue was $13.1B, or 80% of H1'26 total; subscription-based was $3.2B, or 20% (MD&A). That is not "SaaS with a usage kicker"; it is a usage business with a subscription sleeve. Enterprise depth is rising — more than 11,900 customers with ≥$100k TTM revenue as of 30 Sep 2026, plus ~1,900 at ≥$1M and ~250 at ≥$10M (MD&A) — and Net Revenue Retention of about 900% as of the same date is extraordinary (S-1). The counterweight: top five customers were about 25% of revenue for the nine months ended 30 Sep 2026, and no single customer exceeded 10% (Risk Factors). Remaining performance obligations were only $10.8B as of 30 June 2026, with ~75% expected inside 12 months (Note) — a short contractual duration against multi-year compute.
P&L bridge (H1'26 vs H1'25, $ millions).
| H1'25 | H1'26 | |
|---|---|---|
| Revenue | 1,163 | 16,286 |
| Compute & infrastructure | 2,334 | 8,945 |
| Compute as % of revenue | 201% | 55% |
| Personnel | 538 | 3,152 |
| Sales, marketing & partnerships | 120 | 3,168 |
| Other operating & administrative | 306 | 1,714 |
| Operating loss | (2,135) | (693) |
| Change in FV of convertibles / derivatives / SAFEs | (10,942) | (72,388) |
| Net loss | (12,969) | (80,748) |
| Adjusted Operating Income (Loss)* | (1,849) | 1,618 |
\*Excludes stock-based compensation, non-cash charitable contributions and the Bartz settlement. Source: Anthropic S-1.
Two corrections to circulating secondary claims. First, stories that "revenue rose only about $1.2B" appear to confuse the H1'25 base ($1.163B) with the H1'26 print; the filing shows $16.286B. Second, an "implied 85% gross margin" (H1'26 cost of revenue $2.380B against $16.286B revenue in the functional presentation) ignores that Anthropic's total compute & infrastructure expense was $8.945B — 55% of revenue — because most training / research / internal compute sits in R&D, not cost of revenue (Note 8 functional presentation; CNBC discussion of implied GM). Treating customer-serving compute alone as "COGS" flatters the margin. Claims of an "$8.7B cash loss" likewise conflict with disclosed +$3.9B operating cash flow in H1'26 (MD&A Liquidity).
Financing architecture. Broadcom's Infrastructure Partner 2026 NPA allows issuance of up to $42.0B of convertible notes to finance the 2026 Lease Arrangement (Risk Factors). H1'26 financing cash inflows of $110.8B were driven primarily by redeemable convertible preferred stock (MD&A). The IPO is therefore not the company's first capital event of 2026; it is an attempt to put a public-market clearing price on a balance sheet already swollen with private capital and partner paper.
Data Charts
Figure 1: Revenue by period and quarterly run-up
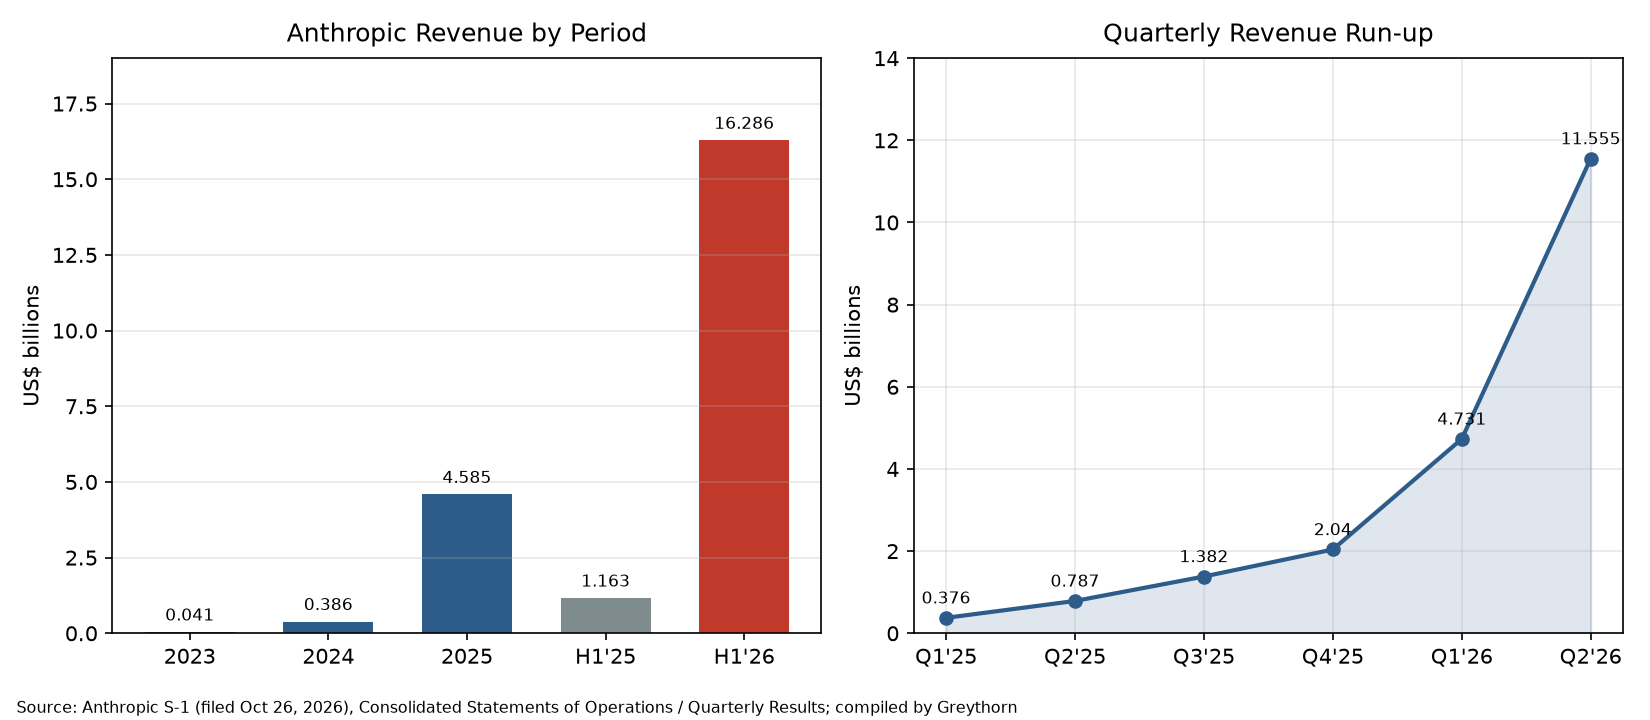
Source: Anthropic S-1 Consolidated Statements of Operations / Quarterly Results; compiled by Greythorn
Figure 2: Operating expense mix, H1'25 vs H1'26
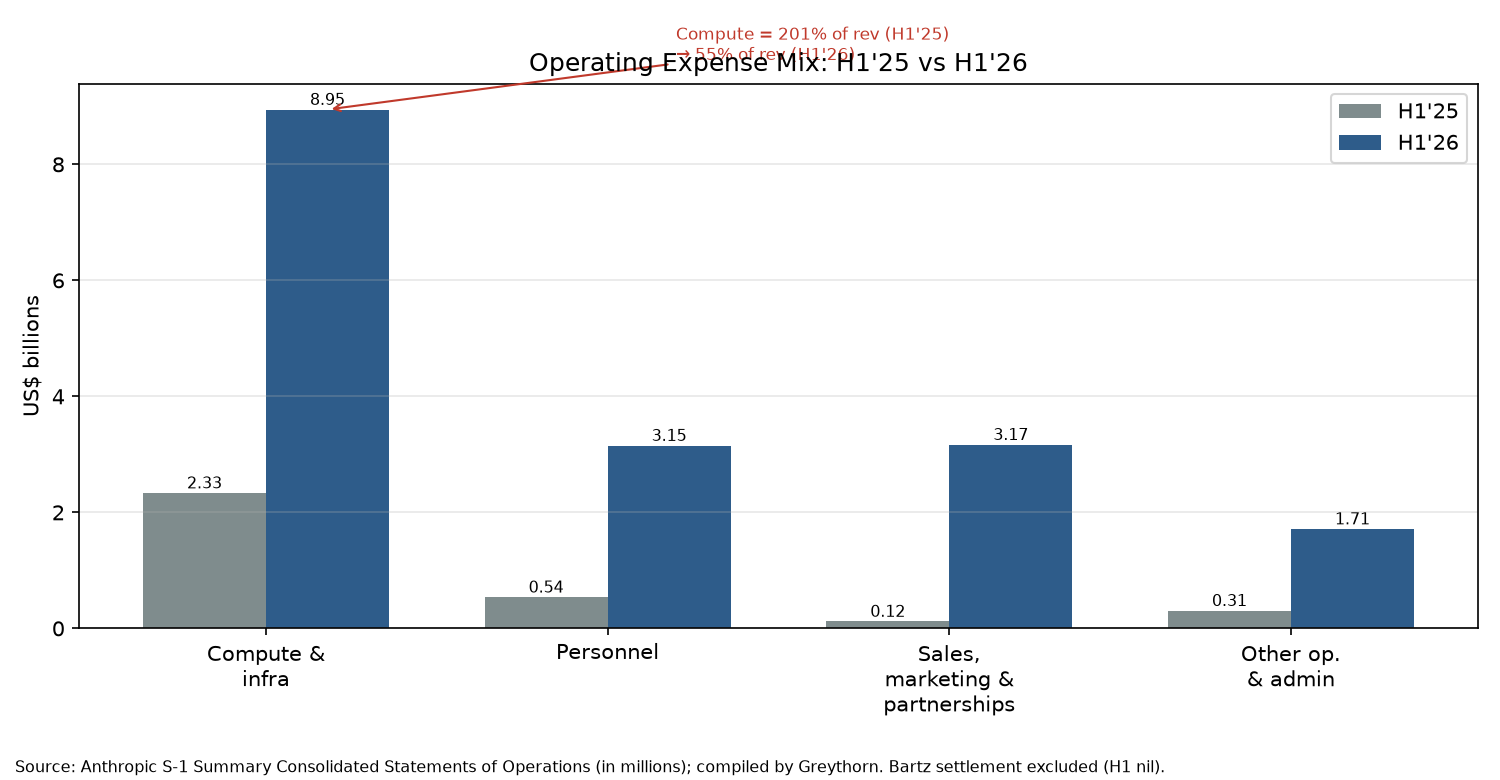
Source: Anthropic S-1 summary statements; compiled by Greythorn
Figure 3: Revenue scale vs. compute intensity (quarterly)
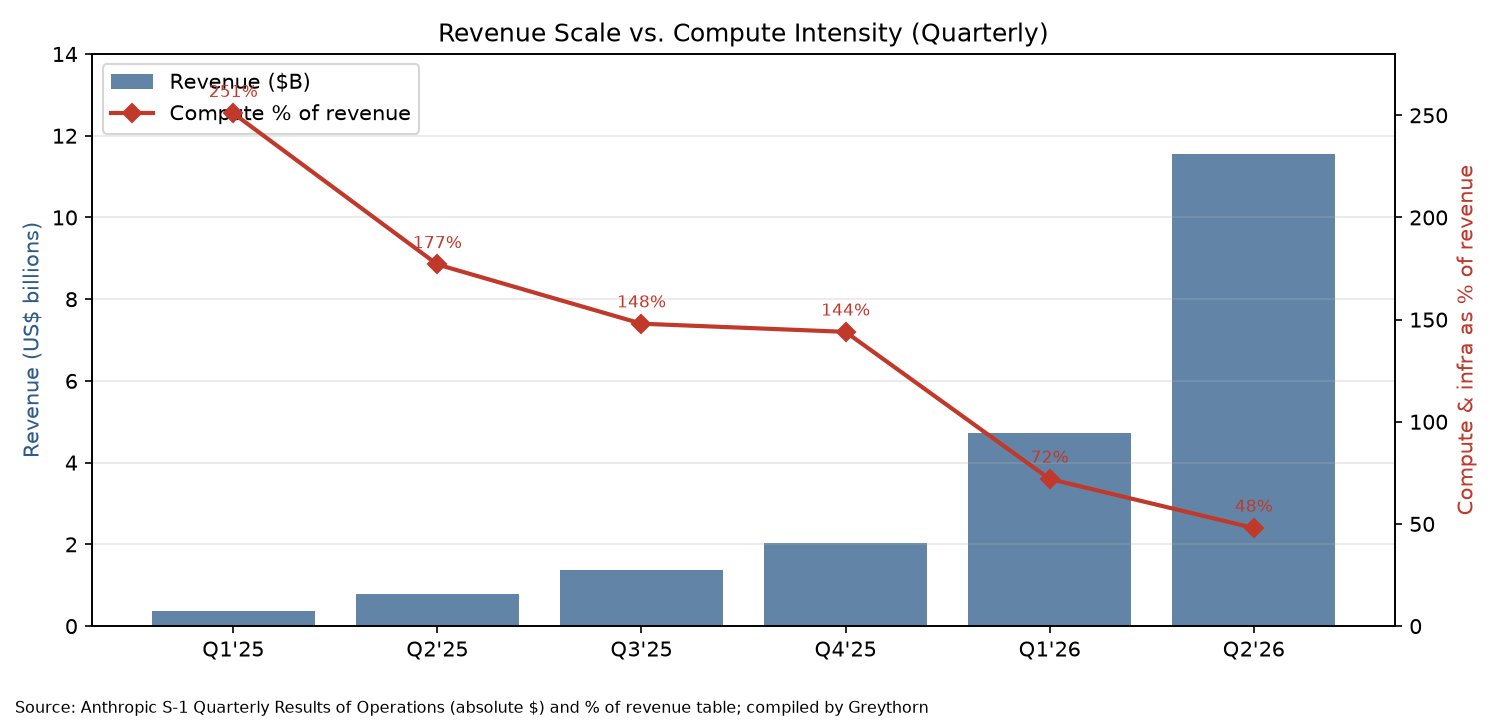
Source: Anthropic S-1 Quarterly Results (% of revenue table and absolute dollars); compiled by Greythorn
Figure 4: Selected disclosed compute commitments vs. H1'26 revenue
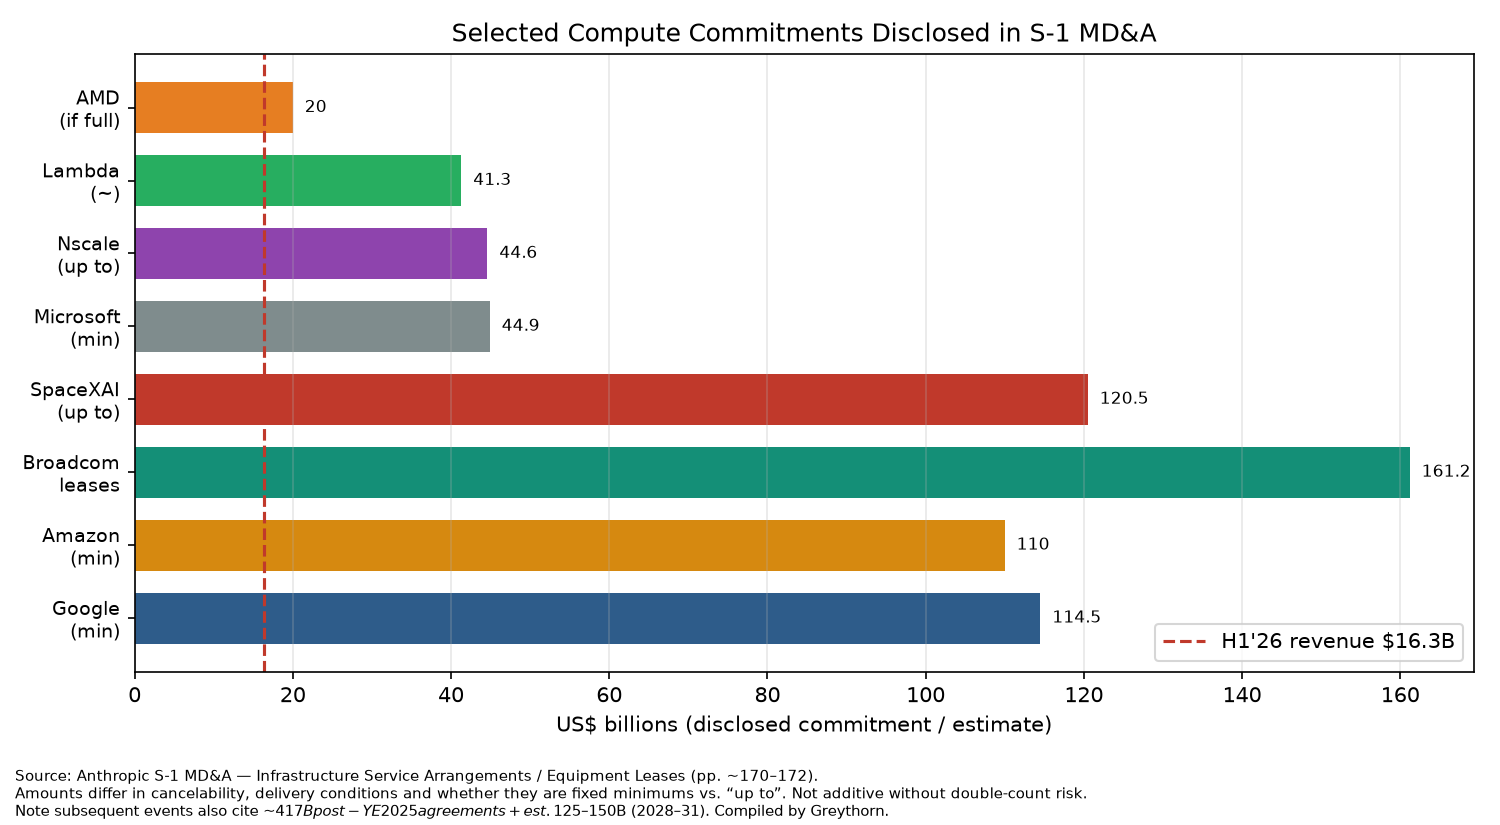
Source: Anthropic S-1 MD&A Infrastructure Service Arrangements / Equipment Leases; compiled by Greythorn. Not a simple additive total.
Figure 5: H1'26 cash generation vs. GAAP net-loss composition
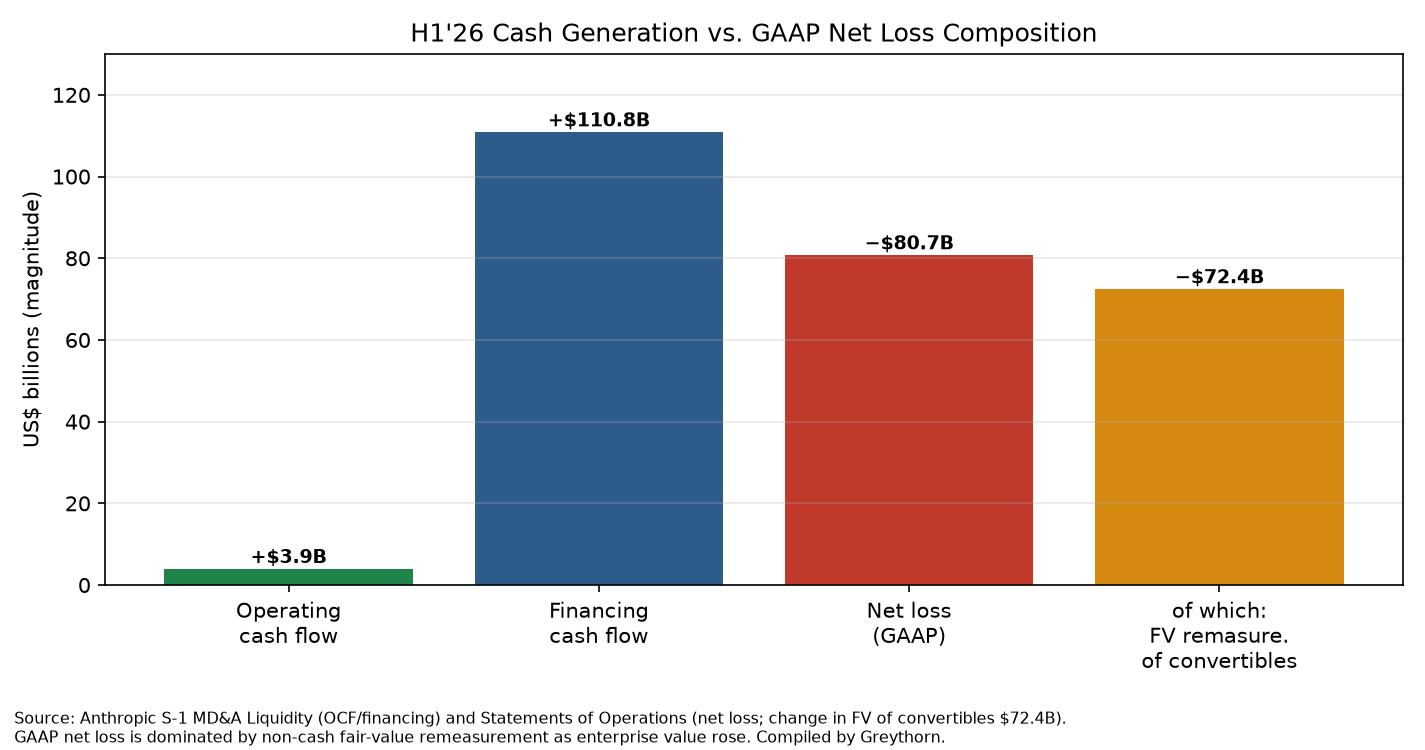
Source: Anthropic S-1 MD&A Liquidity and Statements of Operations; compiled by Greythorn
Competition
Anthropic's own competitive set in the prospectus is short: it names OpenAI and Google as direct frontier-model competitors, plus a broader field of well-capitalized tech companies and open-weight providers (S-1 Competition). That humility is also a warning — the named rivals are either the category creator or a hyperscaler that is simultaneously Anthropic's cloud partner, investor option-holder and competitor.
Public, company-authored OpenAI figures remain thinner than an S-1. OpenAI's CFO letter (18 Jan 2026) cites ARR scaling from ~$2B (2023) to ~$6B (2024) to $20B+ (2025) alongside compute growing from 0.2 GW to ~1.9 GW (OpenAI). Secondary reporting in October 2026 put OpenAI's September annualized revenue near $50B on OpenAI's own definition (which, unlike Anthropic, excludes some cloud-partner revenue) (Reuters via Investing.com). Earlier 2026 reporting cited OpenAI targeting roughly $600B of cumulative compute spend through 2030 (Reuters) — same order of magnitude as Anthropic's reconstructed commitment stack, but not an audited S-1 line.
On the other side of the table, the four U.S. hyperscalers guided mid-year 2026 to roughly $720–745B of combined calendar-2026 capex (Amazon ~$220B cash; Alphabet $195–205B; Microsoft ~$175B incl. finance leases; Meta $130–145B incl. lease principal), per a compilation of their July earnings calls (datacentres.com summary; definitions differ). Anthropic is not a hyperscaler; it is a concentrated buyer of the same silicon those budgets are installing. That is the structural position: growth depends on partners who also compete with it.
Risks
We group the filing's risk surface into five clusters.
- Duration mismatch. Consumption revenue and short RPO versus multi-year, often take-or-pay compute. The MD&A is explicit: if revenue growth does not keep pace with compute-related payments, liquidity and results suffer (S-1).
- Partner conflicts. Amazon, Google and Microsoft are CSPs, distribution channels, investors/financiers and model competitors; Broadcom is both supplier and lessor (Risk Factors). Preferential treatment of in-house models is a disclosed risk, not a conspiracy theory.
- Revenue that should not recur. The company's own 5–7% estimate of policy-violating revenue for the nine months ended 30 Sep 2026, plus stepped-up enforcement in Aug–Sep 2026, is a direct haircut risk to growth optics (MD&A).
- Governance and control. LTBT + Founder LLC + controlled-company status limit ordinary shareholder influence and change-of-control optionality (S-1). Mission alignment may be a feature for some allocators and a bug for others.
- Legal, safety and sovereign risk. The $1.5B Bartz copyright settlement (approved July 2026), ongoing music-publisher and Reddit litigation, weapons-misuse liability language, and the U.S. Department of War "supply-chain risk" designation dispute (split court outcomes; company evaluating next steps) are not footnotes (Notes / Risk Factors). Export-control and government-customer disruptions are called out as potentially material.
Secondary narrative risk belongs here too: once an S-1 exists, every bullish Medium thread that flattens "55% compute" into "85% gross margin" becomes a future credibility problem for the asset class.
Bull Case
- Demand is not synthetic. From $376M in Q1'25 to $11.555B in Q2'26 on the quarterly table is a real adoption curve, reinforced by 900% NRR and rapid growth in ≥$100k customers (S-1).
- Operating leverage has begun. Compute intensity collapsed from 251% of revenue in Q1'25 to 48% in Q2'26; Adjusted Operating Income turned positive in H1'26 (S-1).
- Balance-sheet optionality. $112.4B cash + $19.3B short-term investments (30 Jun 2026), a later upsizing of the revolving facility to $15.0B, and partner NPAs (including Broadcom up to $42B) create multiple funding sleeves (S-1).
- Multi-chip flexibility reduces single-vendor hostage risk relative to a pure-NVIDIA stack, at least on paper (S-1).
- Enterprise embedding (coding agents, workflow products) can raise switching costs faster than pure chat APIs — if retention stays elevated after price cuts and model commoditization.
Bear Case
- Fixed cost, variable revenue. Amazon ≥$110B, Google ≥$114.5B, Microsoft ≥$44.9B, Broadcom leases ~$161.2B aggregate, SpaceXAI up to $120.5B, plus Nscale / Lambda / AMD — against $10.8B of RPO (MD&A / Notes). The bull case needs perpetual re-acceleration of usage.
- Margin mean-reversion. The filing itself warns that operating and adjusted margins will fluctuate when large compute tranches come online (MD&A). Q2'26's 48% compute ratio is a point on a curve, not a terminal state.
- Channel and conflict concentration. Nearly half of revenue touches CSP marketplaces that sell competing models; sales/marketing & partnerships expense jumped to $3.168B in H1'26, largely channel fees (S-1; CNBC).
- Policy and political overhang. Government bans, export controls and safety litigation can remove whole customer segments faster than sales can replace them.
- Governance discount. Public holders buy economic exposure without control; that may compress multiples versus ordinary one-share-one-vote software names when growth slows.
Closing Remarks
Anthropic's S-1 does what an S-1 is supposed to do: it replaces lore with line items. The growth is real. The cash engine in H1'26 was real. The $80.7B net loss is mostly an accounting shadow of private-market mark-ups, not an $80B cash burn. None of that answers the title question. Who pays for the next decade of compute — customers via enduring usage, partners via ever-larger circular financing, or public shareholders via equity duration? The filing shows a company racing to make the first of those three true before the second and third become the only options.
We will keep watching three filing-native gauges: (1) compute & infrastructure as a percent of revenue as new capacity delivers; (2) the policy-violation revenue percentage after the Aug–Sep 2026 enforcement wave; and (3) whether RPO and committed enterprise contracts lengthen relative to the lease and CSP stack. Until those three improve together, the skeptical prior remains: the ledger is clearer, the bill is clearer — the payor is not.
Disclaimer: This article is independent research shared for informational and educational purposes only. It is not investment advice or a recommendation to buy or sell any security. Figures are drawn from public sources cited above; readers should do their own research.
Follow subsequent research on X: @0xGreythorn.